Website Performance Metrics
Compare Visits, Unique Visitors, and Bounce Rate for leading Prop Firms.
Chart Data: Website Performance
| Prop Firm | Visits | Unique Visitors | Bounce Rate |
|---|---|---|---|
| FTMO | 6629760 | 2577345 | 50.67 |
| Funded Next | 5205711 | 1897218 | 38.92 |
| Funding Pips | 4677079 | 1235037 | 37.72 |
| Take Profit Trader | 4373316 | 1839894 | 70.42 |
| Topstep | 3772069 | 897212 | 43.84 |
| the5ers | 2468050 | 534704 | 25.67 |
| Apextraderfunding | 2396890 | 593471 | 37.16 |
| My Funded Futures | 1894952 | 356778 | 31.71 |
| Goatfundedtrader | 1702448 | 414263 | 35.44 |
| Blueberry Funded | 1408835 | 959768 | 72.11 |
| Tradeify | 1082923 | 268097 | 36.08 |
| Blue Guardian | 729318 | 166086 | 52.34 |
| Alphacapitalgroup | 676429 | 257222 | 40.75 |
| Maventrading | 631981 | 318462 | 57.94 |
| Breakoutprop | 573293 | 157769 | 32.77 |
Website Metrics in Numbers
| Prop Firm | Visits | Unique Visitors | Pages / Visit | Avg. Visit Duration (mm:ss) | Bounce Rate |
|---|---|---|---|---|---|
 FTMO FTMO
|
6,629,760 | 2,577,345 | 3.41 | 7:20 | 50.67% |
 Funded Next Funded Next
|
5,205,711 | 1,897,218 | 5.61 | 8:20 | 38.92% |
 Funding Pips Funding Pips
|
4,677,079 | 1,235,037 | 5.68 | 10:02 | 37.72% |
 Take Profit Trader Take Profit Trader
|
4,373,316 | 1,839,894 | 2.19 | 9:01 | 70.42% |
 Topstep Topstep
|
3,772,069 | 897,212 | 5.35 | 8:03 | 43.84% |
 the5ers the5ers
|
2,468,050 | 534,704 | 6.13 | 8:38 | 25.67% |
 Apextraderfunding Apextraderfunding
|
2,396,890 | 593,471 | 6.30 | 9:26 | 37.16% |
 My Funded Futures My Funded Futures
|
1,894,952 | 356,778 | 5.23 | 6:55 | 31.71% |
 Goatfundedtrader Goatfundedtrader
|
1,702,448 | 414,263 | 4.86 | 9:29 | 35.44% |
 Blueberry Funded Blueberry Funded
|
1,408,835 | 959,768 | 2.44 | 6:47 | 72.11% |
 Tradeify Tradeify
|
1,082,923 | 268,097 | 4.80 | 7:30 | 36.08% |
 Blue Guardian Blue Guardian
|
729,318 | 166,086 | 2.85 | 11:11 | 52.34% |
 Alphacapitalgroup Alphacapitalgroup
|
676,429 | 257,222 | 4.25 | 6:44 | 40.75% |
 Maventrading Maventrading
|
631,981 | 318,462 | 3.41 | 9:32 | 57.94% |
 Breakoutprop Breakoutprop
|
573,293 | 157,769 | 6.99 | 14:01 | 32.77% |
 Aquafunded Aquafunded
|
465,704 | 187,189 | 4.88 | 10:03 | 39.26% |
 Fundingtraders Fundingtraders
|
447,011 | 147,293 | 3.90 | 8:02 | 38.16% |
 FXIFY FXIFY
|
442,526 | 211,221 | 5.54 | 10:30 | 48.46% |
 Toponetrader Toponetrader
|
412,018 | 156,465 | 3.57 | 8:51 | 49.71% |
 Fortraders Fortraders
|
377,964 | 104,321 | 4.79 | 8:32 | 36.90% |
Which Prop Firms Get the Most Organic Traffic and Keyword Rankings?
This chart compares each Prop Firm’s estimated organic traffic and total ranking keywords. A strong organic pipeline reduces dependence on paid channels, lowers acquisition costs, and compounds over time.
Chart Data: Organic (Top 15)
| Prop Firm | Traffic | Keywords |
|---|---|---|
| Funded Next | 760000 | 3400 |
| FTMO | 619000 | 5100 |
| Topstep | 457000 | 2500 |
| The 5%Ers | 234000 | 1100 |
| Funding Pips | 187000 | 1500 |
| FXIFY | 63700 | 750 |
| My Funded Futures | 54000 | 529 |
| Apex Trader Funding | 50800 | 1200 |
| Take Profit Trader | 42000 | 232 |
| Goat Funded Trader | 37200 | 906 |
| Fintokei | 35500 | 1600 |
| The Funded Trader Program | 31500 | 392 |
| Seacrest Markets | 28800 | 231 |
| Maven | 28800 | 1300 |
| FunderPro | 22800 | 313 |
Organic Traffic and Keywords in Numbers
| Prop Firm | DR | Keywords | KW Trends (MoM) | Traffic | Traffic Trends (MoM) | Top Country |
|---|---|---|---|---|---|---|
 Funded Next Funded Next
|
65 | 3,400 | -40.35% | 760,000 | -6.17% | IN |
 FTMO FTMO
|
73 | 5,100 | -39.29% | 619,000 | -7.61% | FR |
 Topstep Topstep
|
62 | 2,500 | -43.18% | 457,000 | -6.92% | US |
 The 5%Ers The 5%Ers
|
66 | 1,100 | -50.00% | 234,000 | -7.51% | IN |
 Funding Pips Funding Pips
|
67 | 1,500 | -51.61% | 187,000 | -0.53% | IN |
 FXIFY FXIFY
|
50 | 750.00 | -42.31% | 63,700 | -3.19% | IN |
 My Funded Futures My Funded Futures
|
54 | 529.00 | -34.45% | 54,000 | -20.35% | US |
 Apex Trader Funding Apex Trader Funding
|
72 | 1,200 | -36.84% | 50,800 | -1.74% | US |
 Take Profit Trader Take Profit Trader
|
58 | 232.00 | -44.23% | 42,000 | 7.97% | US |
 Goat Funded Trader Goat Funded Trader
|
46 | 906.00 | 11.30% | 37,200 | 74.65% | NI |
 Fintokei Fintokei
|
53 | 1,600 | 0.00% | 35,500 | -11.03% | JP |
 The Funded Trader Program The Funded Trader Program
|
57 | 392.00 | -12.50% | 31,500 | -8.43% | IN |
 Seacrest Markets Seacrest Markets
|
49 | 231.00 | -56.98% | 28,800 | -18.87% | IN |
 Maven Maven
|
70 | 1,300 | -23.53% | 28,800 | 24.68% | IN |
 FunderPro FunderPro
|
53 | 313.00 | -45.28% | 22,800 | -7.69% | IN |
 Funding Traders Funding Traders
|
49 | 359.00 | -32.01% | 19,400 | 12.79% | IN |
 Blueberry Funded Blueberry Funded
|
44 | 297.00 | -45.90% | 17,600 | -36.00% | IN |
 Alpha Capital Group Alpha Capital Group
|
48 | 408.00 | -56.87% | 15,500 | 1.31% | IN |
 E8 Markets E8 Markets
|
53 | 356.00 | -43.49% | 12,600 | -10.64% | US |
 Aqua Funded Aqua Funded
|
41 | 520.00 | -15.17% | 12,400 | 33.33% | US |
 The Trading Pit The Trading Pit
|
54 | 462.00 | -43.38% | 7,900 | -5.95% | DE |
 QT Funded QT Funded
|
37 | 284.00 | -52.59% | 4,200 | 20.00% | IN |
You might notice it looks like many websites lost a ton of keywords — but that’s mostly because Google recently capped SERPs at 10 results. No more 100-result pages. So, if a site was ranking beyond page one, those positions don’t really count anymore (and weren’t driving much traffic anyway). With AI Overviews taking up even more space, we can think of this as Google’s “clean-up” phase — focusing visibility on the top 10 spots.
Which Prop Firm Is Most Visible in ChatGPT & AI Overviews?
Search behavior is changing. Users don’t just type single keywords anymore—they use natural-language prompts. In the zero-click era, answers appear directly on SERPs and AI surfaces, so it’s critical for Prop Firms to be visible across AI search tools with clear, structured content.
Chart Data: AI Overviews & ChatGPT (Top 15 by combined)
| Prop Firm | AI Overviews | ChatGPT |
|---|---|---|
| FTMO | 569 | 44 |
| Funded Next | 142 | 131 |
| Goat Funded Trader | 139 | 96 |
| Fintokei | 207 | 4 |
| Aqua Funded | 78 | 109 |
| Apex Trader Funding | 65 | 117 |
| Topstep | 129 | 36 |
| Funding Pips | 68 | 69 |
| Funding Traders | 4 | 114 |
| Maven | 83 | 6 |
| The 5%Ers | 18 | 41 |
| FXIFY | 14 | 34 |
| My Funded Futures | 15 | 19 |
| Take Profit Trader | 12 | 12 |
| Seacrest Markets | 11 | 12 |
AI Search Visibility (GEO/AEO) for Prop Firms in Numbers
| Prop Firm | AI Overviews | Chat GPT |
|---|---|---|
 FTMO FTMO
|
569 | 44 |
 Funded Next Funded Next
|
142 | 131 |
 Goat Funded Trader Goat Funded Trader
|
139 | 96 |
 Fintokei Fintokei
|
207 | 4 |
 Aqua Funded Aqua Funded
|
78 | 109 |
 Apex Trader Funding Apex Trader Funding
|
65 | 117 |
 Topstep Topstep
|
129 | 36 |
 Funding Pips Funding Pips
|
68 | 69 |
 Funding Traders Funding Traders
|
4 | 114 |
 Maven Maven
|
83 | 6 |
 The 5%Ers The 5%Ers
|
18 | 41 |
 FXIFY FXIFY
|
14 | 34 |
 My Funded Futures My Funded Futures
|
15 | 19 |
 Take Profit Trader Take Profit Trader
|
12 | 12 |
 Seacrest Markets Seacrest Markets
|
11 | 12 |
 FunderPro FunderPro
|
11 | 12 |
 The Trading Pit The Trading Pit
|
9 | 11 |
 The Funded Trader Program The Funded Trader Program
|
0 | 14 |
 E8 Markets E8 Markets
|
9 | 4 |
 Alpha Capital Group Alpha Capital Group
|
2 | 6 |
 QT Funded QT Funded
|
4 | 1 |
 Blueberry Funded Blueberry Funded
|
0 | 1 |
Brand Visibility — Which Prop Firm Stands Out?
Strong brand visibility keeps you front-of-mind, lowers acquisition costs, and boosts conversion across every channel. Trusted brands earn more clicks, sign-ups, and referrals—translating directly into commercial growth. The chart below shows Trustpilot ratings as an indicator who’s leading on trust and reach.
Chart Data: Trustpilot
| Brand | Total Reviews | New Reviews | Rating |
|---|---|---|---|
| Funded Next | 49395 | 3118 | 4.5 |
| Funding Pips | 35807 | 2984 | 4.5 |
| FTMO | 31939 | 2381 | 4.8 |
| The Funded Trader Program | 22134 | -9 | 3 |
| The 5%Ers | 19059 | 822 | 4.8 |
| Apex Trader Funding | 15856 | 320 | 4.5 |
| Alpha Capital Group | 14630 | 781 | 4.6 |
| My Funded Futures | 12452 | 1410 | 4.9 |
| Topstep | 11744 | 290 | 4.3 |
| QT Funded | 10867 | 1107 | 4.6 |
| Take Profit Trader | 7285 | 886 | 4.5 |
| Maven | 5124 | 253 | 4.6 |
| FXIFY | 4324 | 194 | 4.3 |
| Earn2Trade | 4150 | 207 | 4.7 |
| Goat Funded Trader | 3283 | 106 | 3.5 |
Chart Data: Brand Visibility
| Brand | Total Mentions | Social Media Reach | Non-Social Media Reach | Average Presence Score |
|---|
Prop Firm Reviews on Trustpilot in Numbers
| Prop Firm | Total Reviews | New Reviews | Growth % | Rating |
|---|---|---|---|---|
 Funded Next Funded Next |
49,395 | 3,118 | 6.74% | 4.50 |
 Funding Pips Funding Pips |
35,807 | 2,984 | 9.09% | 4.50 |
 FTMO FTMO |
31,939 | 2,381 | 8.06% | 4.80 |
 The Funded Trader Program The Funded Trader Program |
22,134 | -9 | -0.04% | 3.00 |
 The 5%Ers The 5%Ers |
19,059 | 822 | 4.51% | 4.80 |
 Apex Trader Funding Apex Trader Funding |
15,856 | 320 | 2.06% | 4.50 |
 Alpha Capital Group Alpha Capital Group |
14,630 | 781 | 5.64% | 4.60 |
 My Funded Futures My Funded Futures |
12,452 | 1,410 | 12.77% | 4.90 |
 Topstep Topstep |
11,744 | 290 | 2.53% | 4.30 |
 QT Funded QT Funded |
10,867 | 1,107 | 11.34% | 4.60 |
 Take Profit Trader Take Profit Trader |
7,285 | 886 | 13.85% | 4.50 |
 Maven Maven |
5,124 | 253 | 5.19% | 4.60 |
 FXIFY FXIFY |
4,324 | 194 | 4.70% | 4.30 |
 Earn2Trade Earn2Trade |
4,150 | 207 | 5.25% | 4.70 |
 Goat Funded Trader Goat Funded Trader |
3,283 | 106 | 3.34% | 3.50 |
 Funding Traders Funding Traders |
3,274 | 144 | 4.60% | 3.70 |
 E8 Markets E8 Markets |
2,901 | 57 | 2.00% | 4.40 |
 Seacrest Markets Seacrest Markets |
2,841 | 93 | 3.38% | 4.30 |
 Top One Trader Top One Trader |
2,375 | 237 | 11.09% | 4.50 |
 City Traders Imperium City Traders Imperium |
1,513 | 29 | 1.95% | 4.30 |
FAQ
Why is my Prop Firm not listed in this report?
Some traders ask why a specific Prop Firm is missing. Not every firm is included because the focus is on well-known and established providers. If a newer or smaller firm is not listed, it usually means there is not enough reliable data available yet. The list of Prop Trading Firms is updated regularly as the industry grows.
Why are Telegram groups for Prop Trading not included?
Many traders search for Telegram groups of Prop Firms, but Telegram is hard to measure. Group sizes and activity levels are often private, making it difficult to include them in reliable statistics. Once accurate data sources become available, Telegram groups will be part of future prop trading analyses.
Why are Prop Trading Discord servers not included?
Discord is a popular platform for traders to connect with Prop Firms, but measuring server activity, membership numbers, and engagement is not reliable at this point. For that reason, Discord servers are not part of the current analysis, although this may change in the future.
How can I contribute to Prop Firm reports and rankings?
Traders and Prop Firms can support research by providing verified data, suggesting new data sources, or linking back to this analysis. Sharing the report in the trading community also helps other traders discover it and ensures more visibility for the firms that are included.
How can Prop Firms get featured in Prop Trading rankings?
Prop Firms that want to be included in rankings and industry reports can contribute verified data or collaborate on research. This ensures traders have access to accurate information and helps Prop Firms increase their visibility in the trading community.
Data Sources
Organic traffic data, including AI Overviews and ChatGPT visibility, was sourced from Ahrefs.
Website Performance Data comes from SEMrush
Social media data was collected from each company’s main global account, unless a regional account showed significantly stronger performance. Only one account per Prop Firm was considered.
Trustpilot data was taken directly from the Trustpilot website.
All data is as of 23 November 2025.
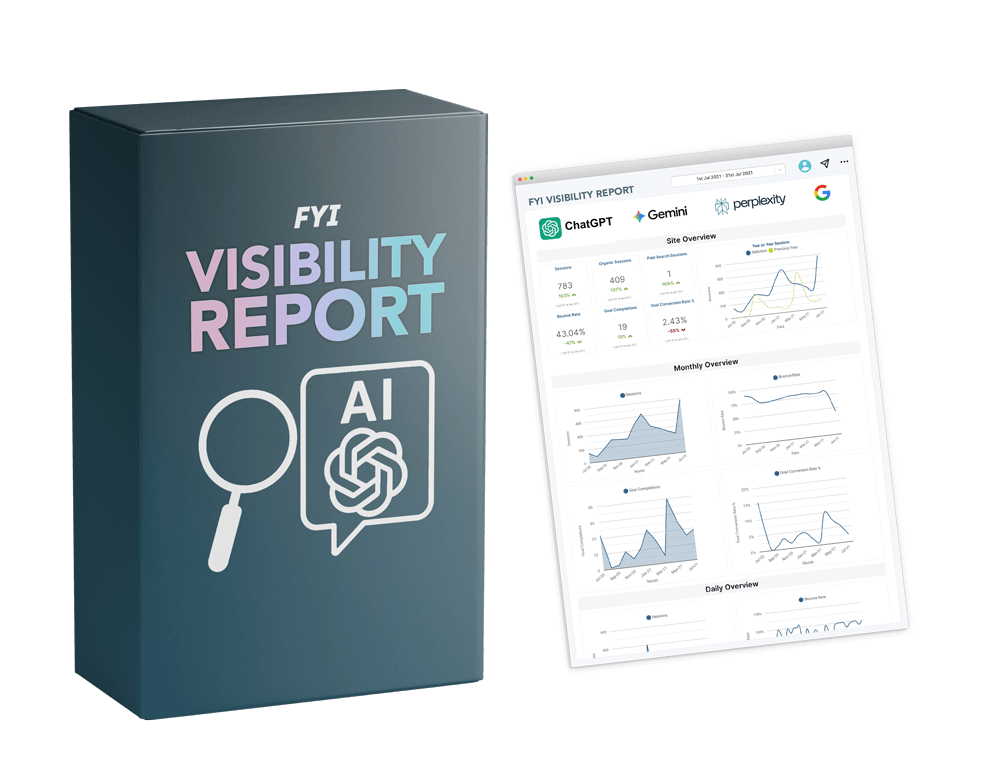
Boost Your Brand Visibility
Discover where your brand stands in the new AI-driven search era. Get a tailored, analyst-crafted Visibility Report that helps you stay competitive and make data-driven decisions.
- Weekly PDF reports to understand Brand & Social Media Performance
- Competitor tracking & social listening across chosen channels
- AI search visibility (ChatGPT, Perplexity, Gemini, Google AI Overview)


Which Prop Firms Are Most Popular on Social Media?
Who’s winning attention on social? This section ranks Prop Firms by follower reach to highlight brand visibility and momentum. Use it to benchmark competitors, spot growth opportunities, and focus your content where it’ll have the biggest impact.
of the Top 5 Prop Firms
of the Top 5 Prop Firms
of the Top 5 Prop Firms
of the Top 5 Prop Firms
Pie Source Data
Instagram
X
YouTube
TikTok
Who Leads on Instagram Among Prop Firms?
Who Leads on X Among Prop Firms?
Who Leads on YouTube Among Prop Firms?
Who Leads on TikTok Among Prop Firms?